Writing a lab report
Introduction: This page contains a list and explanations of the sections needed in the write-up of a science experiment (lab report). A sample lab report is shown on the right to help ESL students understand clearly what must be done to get a good grade in this kind of written work.*
* IMPORTANT: Please note that the example lab report shown in the right column is not an authentic one. It is not based on any actual experiment and does not reflect scientific reality. It has been written to exemplify the sections of a typical lab report, in such a way that ESL students can understand what is expected of them in doing writing of this kind.
Do a quiz to identify the different sections of a lab report: Writing Quiz - Matching Quiz.
| Lab report sections | Explanation | Example | ||||||||||
| Name, Date, Title: | The title is what the experiment is about. The teacher will usually give you the title of your lab report. |
Your name |
||||||||||
| Aim: | This is what you want to find out from the experiment. The aim is usually written as a question. | Does salt water reach 100°C at the same speed as tap water? | ||||||||||
| Hypothesis: | This is your prediction of the answer to the question (before you actually do the experiment). You should state the reason(s) for your hypothesis. | My hypothesis is that salt water will reach 100°C more slowly than tap water because it is thicker. | ||||||||||
| Variables: |
This is the name for the aspects of the experiment that
change or must be kept the same. There are 3 kinds of variable: - independent - dependent - controlled
|
Independent: Amount of salt Dependent: Time measured in seconds Controlled: Amount of water; temperature of the Bunsen burner flame
|
||||||||||
| Apparatus: | The science equipment that you need to do the experiment; beakers, Bunsen burner, stopclock, etc. Many teachers also require you to list the chemicals you use; salt, sulphuric acid, etc. | Two each of: beaker, tripod, Bunsen burner, stop clock, thermometer.
|
||||||||||
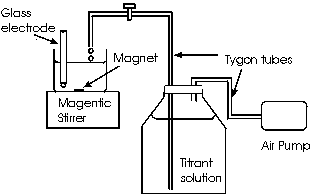
| Diagram: | This is a picture showing how you set up the apparatus in order to do the experiment. (This is usually necessary only if the set-up is complicated.) |  Note: This is a sample of labelled diagram. It is not a diagram showing the experiment to determine the boiling point of salt water. |
||||||||||
| Method: | These are the step-by-step instructions stating how the experiment is to be done. | 1. Fill both beakers with 200ml water from the tap. 2. Add 5g salt to one of the beakers 3. Turn on both Bunsen burners at same time. 4. Turn on both stop clocks. 5. Use thermometers to measure the temperatures in both beakers. 6. Record the time when the temperature reaches 100°C. 7. Repeat 1-7 above with 10g, 15g, 20g salt.
|
||||||||||
| Results: | This section shows the data or information you collected when doing the experiment. The data is often shown in a table. |
|
||||||||||
| Analysis: |
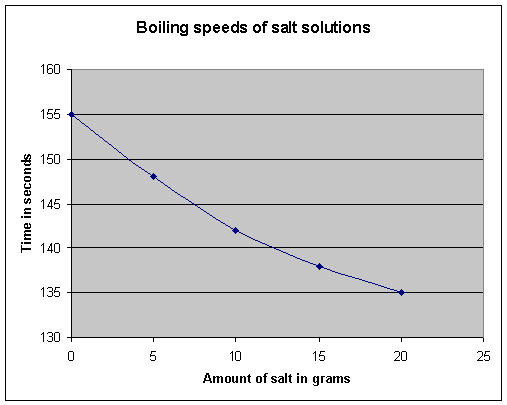
This is usually a graph or other chart that shows the
experiment data (your results) in a way that is easy for the reader to
understand the most important findings. It is important that graphs are correctly labelled to show the units of measurement. Sometimes it is important to write about the graph or chart, especially if you think that the data needs to be explained more clearly.
|
 |
||||||||||
| Conclusion: | This is where you write about the results/analysis and say whether your hypothesis was right or not. You should write about any unexpected findings. | My hypothesis was wrong. In fact, the opposite is true: the more salt there is in the water, the more quickly the water reaches 100°C. This is because .. | ||||||||||
| Evaluation: | This is what you write about the experiment itself; if you had any problems; if you have suggestions for improvement, etc. | The experiment was easy to understand and to do for two students working together. However, there was a problem with controlling the two Bunsen burners to make sure they burned at exactly the same temperature. |
Note: Sometimes your teacher will tell you that you do not need to include all the sections in your lab report. For example, you may not need to state the variables in a separate list, or you may not need to draw a diagram.
If you are not sure exactly what you must include, ask your teacher. (Remember the UDS method.)